Статьи по темам
Фотогалерея
IMAGES OF CORONA DISCHARGES IN PATIENTS WITH CARDIOVASCULAR DISEASES
IMAGES OF CORONA DISCHARGES IN PATIENTS WITH CARDIOVASCULAR DISEASES
AS A PRELIMINARY ANALYSIS FOR RESEARCH OF THE INFLUENCE OF TEXTILES ON
IMAGES OF CORONA DISCHARGES IN TEXTILES' USERS
Izabela Luiza Ciesielska - Wróbel¹ , Iwona Szadkowska² , Józef Masajtis¹ , Jan Henryk Goch³
¹Institute of Architecture of Textiles, Faculty of Material Engineering and Pattern Designing,
Technical University of Lodz, Poland
²Department of Internal Diseases and Cardiological Rehabilitation, Medical University of Lodz, Poland
³Department of Cardiology and Cardiac Surgery, The S. Sterling University Hospital in Lodz, Poland
Abstract:
Purpose: The aim of the study was to assess changes in images of corona discharges (ICD) in patients with cardiovascular diseases A corona discharge is an electrical discharge brought on by gases surrounding a conductor - animate or inanimate objects.
Methods: The study population of 126 persons (81 men and 45 women) was divided into two groups: the study group consisted of 96 patients with coronary heart disease and the control group composed of 30 healthy persons. The study methods included recording of corona discharges of fingertips of both hands by using the Gas Discharge Visualization (GDV) Camera and analyzing changes in images of corona discharges dependent on conditions of medical examinations of patients, their frame of mind, age, gender, heart rate, blood pressure, serum potassium concentration, and the course of coronary heart disease.
Results: Age, gender, temperature in examination rooms as well as frame of mind of the study population exerted a similar effect on ICD in both groups. Heart rate, blood pressure and the pattern of coronary heart disease exerted varied effects on the patients' ICD parameters in the study group.
Conclusions: The analysis of changes in ICD may be a source of information about the effect of physiological and pathophysiological changes in the human health state, physical as well as mental.
Introduction
Corona discharge photography also known as bioelectrography is the method used to reveal and record corona discharges created around an object, e.g., human fingertips. An image can be induced when the strong electric field of high voltage (10 kV) and high frequency (1024 Hz) is produced. A
digital camera placed within the area of corona discharges records this phenomenon. The occurrence of this phenomenon has been well known for more than two centuries, but it was rendered famous only in the 1950s, owing to studies carried out by Semyon Dawidowicz Kirlian, hence it became known as
Kirlian's photography.
A corona discharge is an electrical discharge observed in gases, which occurs on the surface of charged conductors. In the presented study, the Gas Discharge Visualization (GDV) Camera was used to visualize corona discharges images and the GDV Processor Program was employed to analyze them
[1, 2].
An object is placed on the optic plate (1) (Figure 1, page 15), voltage generator is on (4), generated current parameters: 0.1 MV and 1024 Hz. In the induced electrical field, charge carriers (free electrons and positive or negative ions) (3) present in the air surrounding the surface of optic plate (2) and the object (1) collide with other charge carriers, interacting with one another (they attract themselves and mutually neutralize excess of different charges). Electric impulse transmitted to the plate after placing an object on it stimulates the response of the object, pronounced inter alia by the movement of charge
carriers. Acceleration of their movement constantly occurs in the conditions of stable ionization process evoked only by charging high frequency current [3,4]. The occurrence of ionization collisions creates an electron avalanche. Ionization (electron dissociation from atom) in the electrical field results from collision of neutral atoms (or those previously excited) with free electrons accelerated by the field forces [3]. Free electron re-association is followed by a visible glow. This phenomenon is recorded around the fingertip (Fig. 1-8).
Numerous previous studies involving corona discharges, have provided evidence that discharges generated around non-living objects, e.g., coins or stone, do not change their form or shape
over time. Corona discharges generated around living organisms are characterized by variations over time [5-9]. This observation suggests that exogenous environmental events, lifestyle, and physical state (also psychic state in humans) [10] of study objects may influence corona discharges generated around a given animated object [5, 8,11, 12].
In reports published to date, there are no findings on the effect of changes in essential hemodynamic and biochemical parameters or the pathology of the circulatory system on the image of corona discharges.
The aim of the study was to assess changes in the image of corona discharges in patients with cardiovascular diseases dependent on their age, gender, frame of mind, heart rate (HR), blood pressure (BP), and serum potassium concentration as well as to analyze the differences in ICD between patients with coronary heart disease (CHD) and the control group.
The authors believed that the influence of the physiological factors on image of corona discharges in patients with cardiovascular diseases might be more significant than any other factors, like textiles that humans wear [12-18]. This research is a base for other analysis carried out in the area of the influence of textiles on humans.
Methods
In all, 96 patients (74 men, aged 35-80 years, mean, 60 ± 10 years and 22 women, aged 22-79 years, mean, 60 ± 14 years) were eligible for the study. Of this number, 56 patients were hospitalized because of coronary heart disease in the Department of Cardiology and Cardiac Surgery, The S. Sterling University Hospital, Lodz, and 40 patients were hospitalized because of other diseases (organic heart disease, arrhythmia and conduction disorders) (Table 1). The control group was
composed of 30 clinically healthy persons (7 men, aged 19-52 years, mean, 33 ± 13 years and 23 women, aged 20-43 years, mean, 25 ± 5 years). All examinations were performed in the same conditions in the room temperature of 19-25oC, relative humidity of 22-36% and atmospheric pressure of 965-1008 hPa. During examinations, the patients were dressed in hospital clothing. On the day of examinations, both the study and control groups neither smoked nor used medication.
Table 1. Characteristics of patients with CHD and comorbidities eligible for the study.
| Characteristics | Women | Men |
| No. of patients (%) | No. of patients (%) | |
| CHD | 10 (10,414) | 20 (20,834) |
| CHD + auricular fibrillation (AF) | 1 (1,041) | 3 (3,125) |
| CHD + arterial hypertension (AH) | 4 (4,167) | 15 (15,625) |
| CHD + diabetes type II (DM) | 1 (1,041) | 2 (2,084) |
| Other conduction disorders or arhythmia | 12 (12,5) | 28 (29,166) |
Examination methods comprised: 1) a questionnaire-based rating of patients' frame of mind, including a 15-item scale with categories of responses ranging from extremely poor to extremely good frame of mind; 2) HR and BP measurements; 3) measurements of serum potassium concentration; and 4)
generation of ICD of all fingertips of the investigated hands.
ICDs were recorded with use of the GDV Camera, parametric images were analyzed with use of the GDV Processor Program, and Statistica for Windows, version 5.1. was employed in the statistical analysis. A multiple regression model was used to analyze the effect of subjects' examination conditions, frame
of mind, age, gender, HR, BP, serum potassium concentration, CHD and comorbidities (AF, AH, and DM) on ICD.
The study design was approved by the Bioethics Committee of the Medical University of Lodz (4 January 2005, No. RNN/13/05/KB).
Results
The effect of the subjects' frame of mind on ICD was observed in the study as well as in the control groups. It was found that extreme emotions in persons of both groups had the most significant impact on ICD. Extremely poor frame of mind (scores 1 and 2 on a 15-item scale of responses) influenced the standard deviation (SD) of autocorrelation of the angle created by pixels of the same brightness present in the middle part of ICD (Fig. 1-9b). Self-rating of extremely poor frame of mind by both ill and healthy persons increased the SD value, which indicated substantial differences in the pixels brightness of the image in its middle part. An analogous situation was observed in case of the opposite situation.
Self-rating of extremely good frame of mind (scores 14 and 15 on a 15-item scale of responses) increased the SD value from the mean entropy of the radius length measured from the center of the image (Fig. 1-a) to its middle part. This means substantial differences in the radius length reflected in the less uniform, i.e. more 'frayed' image edge.
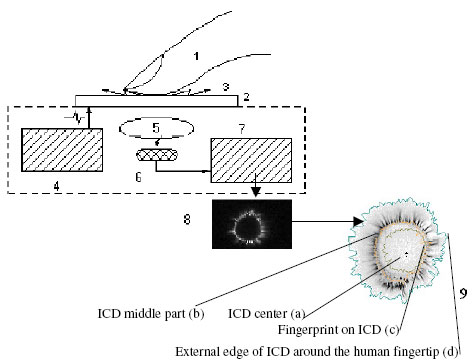
Figure 1. Schematic representation of the system used to visualize ICD along with the processed ICD, where: 1- study object; 2- optic glass (plate) connected to a power source; 3- discharge; 4- voltage
generator; 5- optic system; 6- CCD camera (Charge-Coupled Device system with charge-coupling, technology involving light-sensitive elements); 7- image transducer; 8- image of discharges on the computer monitor; 9- processed and analyzed image of discharges [7, 13-14].
The age-dependence analysis showed that the SD value decreased with ageing of an organism. SD diminished from the mean value of entropy of radius length in images, measured from the image center to its middle part and from its center to its external edge (Fig. 1-9d). This means that in ICD of older persons, the radius length dispersion was lower, i.e. the image edge was more uniform and less 'frayed'. Similar relationships were observed when analyzing the data of images visualized in controls. In addition, it was found (only in the study group) that the older the patient the lower the image autocorrelation defined for pixels of the same brightness present along the fingerprint line (Fig. 1-9c), i.e. less ordered pixels in the fingertip line on the image in terms of their brightness.
The effect of the patients' gender on ICD was also observed. In images recorded in men, SD from the mean value of brightness for the middle part of the image was lower than in those recorded in women, which means that in the former there was better unification of pixels brightness. A similar observation was made with respect to SD from the mean value of length of radius measured from the center of the image to its external edge. This in turn means a more uniform external contour of discharge images in men compared with women. Having analyzed ICD in the control group, the same relationship
was found.
Heart rate/min influences the mean value of entropy of pixels brightness within its whole range, i.e. the mean value of entropy of pixels brightness decreased with the increasing patient's HR, and thus contributed to better unification of pixels in terms of their brightness. In addition, the increased HR enhanced the total area of corona discharges, which means an enlarged area of discharges around the fingertip.
A significant effect of systolic BP on ICD was found. Its increase within the range from 90 to 190 mmHg was followed by an increase in the mean value of entropy of pixels brightness in the middle part of ICD and its external edge. A standardized area (the ratio of the total number of ICD pixels recorded around the fingertip to the contour defined by the fingertip print on images derived from patients) increased with increasing systolic BP value. Both relationships were linear. No significant effect of diastolic BP was found.
Having analyzed the effect of serum potassium concentration on ICD, it was found that the higher the concentration the higher SD from the mean value of autocorrelation of the angel created by pixels with the same brightness of the whole ICD. This means that the increased potassium concentration exerted
an adverse effect on the ICD unification with respect to pixels brightness because it leads to extensive dispersing of pixels brightness around the mean values in analyzed images.
There were differences in ICD between CHD patients and the control group. In CHD patients, the number of noises occurring in ICD was increasing, whereas in the control group this phenomenon was not observed. By the number of noises one understand the occurrence of a set of up to 30 pixels separated from ICD.
In the group of patients with CHD + AF, along with the increased number of noises, the diminished mean value of entropy of pixels brightness in the external edge of the image was observed. In the group of patients with CHD + AH, along with the increased number of interferences, the increase in the
mean value of entropy of pixels brightness in the middle part of ICD and its external edge as well as the increase in the standardized area were observed. In the group of patients with CHD + DM, along with the increased number of noises, the decreased SD from the mean value of autocorrelation of the
angel created by radiuses measured from the center of the image to its external edge, were observed. This means that edges in ICD of these patients were more uniform and less 'frayed'. However, there was no influence of organic heart disease or arrhythmia and conduction disorders on ICD.
The study indicated in both groups the effect of the examination room temperature and air humidity on ICD. The mean value of entropy of the length of radius measured from the center of the image to its external edge increased with increasing ambient temperature. Variation in radius length increased with increasing ambient temperature, which in turn created a very differentiated external contour of the image. There was no statistically significance dependence between atmospheric pressure or relative humidity and ICD in either of the groups.
Discussion
Lets consider how it is possible that ICD points on certain relations with state of patients. It is believed that all what one observed in ICD is connected with discharges in sweat on finger tip. The composition of sweat determines the character and the variations of corona discharge on CDP. It is possible to combine that information with knowledge about symptoms of certain disease e.g.: with potassium concentration in patients and with ICD. Parametric analysis of ICD showed that nine parameters may play the role of significant indicators in assessing the effect of varied factors on corona discharge
image in humans.
Parameter ICD 1 - Standard deviation from the mean value of autocorrelation of the angle created by pixels of the same level of ICD brightness. Changes in this parameter were closely related to both the health of persons participating in the study and their serum potassium concentration. Increased SD in
ICD resulted from extremely negative emotions induced, e.g., by fears associated with expected hospitalization and hospital treatment (the study group - pre-examination interview) or from general bad mood caused by difficult situation in life (the control group - pre-examination interview) and serum potassium level (the study group). The frame of mind was self-rated as very poor by 7% of persons in the study group and by 3,2% of persons in the control group, whereas 4,2% and 3,3% of persons, respectively self-rated their frame of mind as very good (there was no statistical significance).
Table 2. Values of ICD 1 parameter and potassium concentration in patients with extremely poor frame of mind (given as an example).
| Parameter ICD 1 | Potassium concentration [mmol/L] |
| 15,51 | 4,36 |
| 25,79 | 4,36 |
| 15,60 | 4,36 |
| 11,06 | 4,36 |
| 34,11 | 4,62 |
| 41,35 | 4,98 |
| 41,94 | 4,98 |
| Mean 22,58 | Mean 4,57 |
| SD 10,36 | SD 0,29 |
The mean potassium level in the study group was 4,37 ± 0,32 (range for this group: 3,57 ÷ 5,65), the range of potassium levels in patients who rated their frame of mind as extremely poor was 4,36 ÷ 4,98 (mean, 4,57 ± 0,29). The mean value of ICD 1 in the study group was 22.07 ± 12.48; the mean value given as an example in Table 2 - 22,58 ± 10,36. The effects of serum potassium concentration and extremely poor frame of mind on ICD were independent of each other, but when the enhanced potassium level (within the range) was concurrent with poor frame of mind, the progressive increase in SD from the mean value of autocorrelation of the angle created by pixels of the same brightness was observed.
Table 3. Values of ICD 2 parameter for the 10 youngest patients (their frame of mind was taken into account).
| Parameter ICD 2 | Age | Extremely good frame of mind |
| 0,14 | 22 | Yes |
| 0,05 | 28 | No |
| 0,09 | 38 | Yes |
| 0,05 | 40 | No |
| 0,05 | 43 | No |
| 0,11 | 44 | No |
| 0,07 | 44 | No |
| 0,08 | 44 | No |
| 0,12 | 45 | No |
| 0.14 | 46 | No |
Parameter ICD 2 - Standard deviation from the mean value of entropy of length of radius measured from the center of ICD to its middle part (and from the center of the image to its external edge). Changes in ICD 2 were dependent on both age and extremely good frame of mind. However, the ICD 2 value decreased with ageing while extremely good frame of mind increased its value, which means that the effects of age and frame of mind could neutralize each other. Table 3 gives examples of extreme cases.
Table 4. Values of ICD 2 parameter for the 10 oldest patients (their frame of mind was taken into account).
| Parameter ICD 2 | Age | Extremely good frame of mind |
| 0,29 | 73 | No |
0,17 | 74 | No |
| 0,06 | 74 | No |
| 0,07 | 75 | No |
| 0,13 | 77 | No |
| 0,06 | 77 | No |
| 0,07 | 78 | No |
| 0,05 | 79 | No |
| 0,19 | 79 | No |
| 0,17 | 80 | Yes |
In the study group, the mean value of ICD 2 was 0,08 ± 0,001; for the 10 oldest patients the mean was 0,126 ± 0,007, whereas for the 10 youngest patients this value was by 40% lower (0,09 ± 0,003) (p < 0,05). The same differences were observed in the control group.
Parameter ICD 3 - Autocorrelation of pixels of the same brightness present in the line of the finger print on ICD. The older the patient, the lower the value of this parameter. The effect of age on ICD 2 was independent of other factors, e.g., frame of mind patients.
Parameter ICD 4 - A standardized area (the ratio of the total number of pixels of the fingertip ICD to the contour defined by the finger print on the patients' ICD). The standardized area increased with increasing systolic BP. In addition, the area of discharges increased with increasing HR.
Table 5. Values of ICD 4 parameter along with systolic BP and HR for 10 patients with the lowest levels of systolic BP.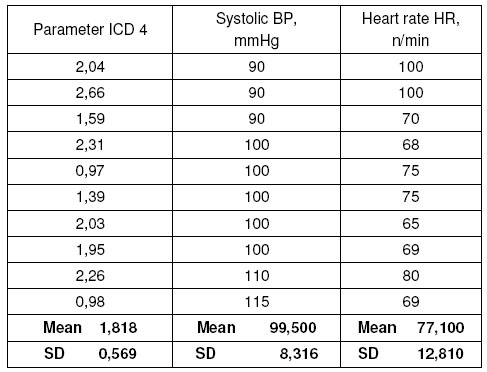
ICD 4 was by 61% higher in 10 patients with the highest systolic BP than in the 10 patients with the lowest systolic BP (p < 0,005). In the same group of patients HR was by 6,8% higher than in patients with the highest systolic BP (p < 0,005).
Table 6. Values of ICD 4 parameter along with systolic BP and HR for 10 patients with the highest levels of systolic BP.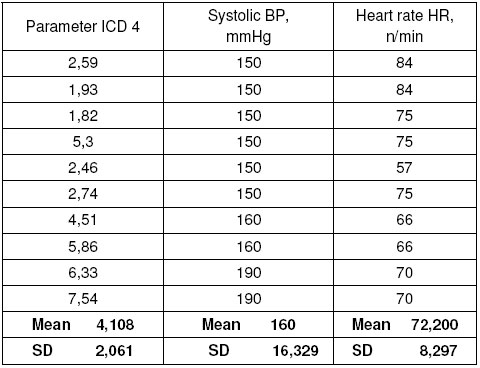
Table 7. Values of ICD 4 parameter with systolic BP and HR for 10 patients with the lowest HR values.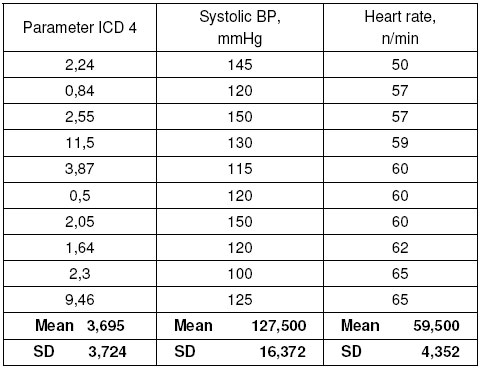
Table 8. Values of ICD 4 parameter with systolic BP and HR for 10 patients with the highest HR values.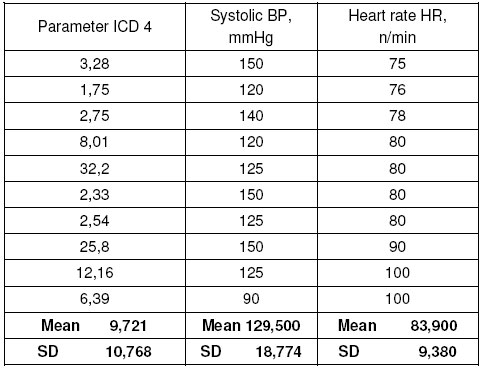
ICD 4 was by over 41% higher in 10 patients with the highest HR values than in 10 patients with the lowest HR values (p < 0,05). In the same group of patients, systolic BP was by 1,5% lower than in patients with the highest systolic BP (difference statistically insignificant). HR and systolic BP influenced the increase in ICD 4 independently from each other.
Parameter ICD 5 - The number of noises emerging on ICD. ICD 4 was by 4% higher on average on ICD of patients treated only for CHD than on ICD of patients with CHD + DM like in the CHD + AH group (p < 0,05), and by 20% higher than on ICD of patients with CHD + AF (p < 0,05). There was no statistically significant differences in the number of noises between ICD of patients with CHD, CHD + DM, CHD + AF, CHD + AH and that of patients with arrhythmia and conduction disorders.
Parameter ICD 6 - The mean value of entropy of the length of radius measured from the center of the image to its external edge. The increase in ICD 6 value resulted from the increased ambient temperature. It was noted that its value decreased with ageing of an organism. At temperature of 19-20oC, the ICD 6 value was by 12% lower compared to ICD of patients with the ambient temperature of 24-25oC (p < 0,08). ICD 6 was also influenced by age. On ICD of the 10 youngest (22-46 years) patients ICD 6 reached the value by 15% higher than that found in the 10 oldest (73-80 years) patients (p < 0,005).
Parameter ICD 7 - The mean value of entropy of the level of pixels brightness within the whole ICD. ICD 7 increased with increasing systolic BP and decreasing HR in patients. In the group of patients with CHD + AF, ICD 7 was lower than in other groups (p < 0,001). However, the differences between patients from other groups were not statistically significant.
Parameter ICD 8 - Standard deviation from the mean value of autocorrelation of the angle created by radius measured from the center of the image to its external edge. The ICD 8 value mostly decreased in the group of patients treated for CHD + DM. In the other groups, ICD 8 showed higher values, although there were not statistically significant (p < 0,05). ICD 8 like ICD5 allows for differentiation between CHD with and without comorbidities. The ICD 8 value in patients treated for CHD + DM was by about 2% lower than that in the remaining groups.
Parameter ICD 9 - Standard deviation from the mean value of the pixels brightness measured from the center of the image to its middle part. The ICD 9 value was gender-dependent. The ICD 9 value in men was by about 10% lower than that observed in women (p < 0,008).
Conclusions
The analysis of ICD changes may be a source of information about the effect of physiological and pathophysiological changes in the human body. It should be stressed that the interpretation of results is difficult because of variability of corona discharge which strongly depends on temporary influences of sweat and air humidity. It is the first report on the effect of the circulatory system pathology
on variability in ICD generation. It is likely that further studies of bio-electrography will contribute to better use of the observed changes in corona discharge photography in assessing pathologies in humans.
References:
1. Korotkov K., Korotkin D.: Concentration dependence of gas discharge around drops of inorganic electrolytes. J. Appl. Phys. 89 (9), May 2001.
2. Korotkov K., Krizhanovsky E., Borisova M.: The dynamic of the gas discharge around drop of liquids. J. Appl. Phys. 95 (7), April 2004.
3. Flisowski Z.: High Voltage Technique. Scientific and Technological Publications (WNT), 1999 (in Polish).
4. Loeb L.B., Electrical Coronas. University of California Press, 1965.
5. Korotkov K.: Aura and consciousness. A new stage of scientific understanding. Russian Ministry of Culture, St Petersburg division. Editing & Publishing Unit "Kultura", 1998.
6. Kudowska T.: Application of the Kirlian technique in assessing the effect of a particular type of textiles on the human body [dissertation]. Technical University of Lodz, Lodz, 1986 (in Polish).
7. Ciesielska I.L.: Identification of traits contributing to more user-friendly textiles [dissertation]. Technical University of Lodz, Lodz, 2001 (in Polish).
8. Iovine J.: Kirlian Photography, a hand-on guide. TAB Books, USA, 1994.
9. Szosland J.: Corona discharges in the man-textile relation. Part I. Textile Review (in Polish: Przeglad Wlokienniczy) 12, 2003.
10. Pehek J., Kyler H., Faust D.: Image modulation in corona discharge photography. Science 4262 (194), October 1976.
11. Opalinski J.: Kirlian-type images and the transport of thinfilm materials in high-voltage corona discharges. J. Appl. Phys. 50 (1), January 1979.
12. Ciesielska IL: Images of corona discharges as a source of information about the influence of textiles on humans. AUTEX Research Journal, Vol. 9, No1, March 2009 .
13. Ciesielska I.L., Masajtis, J.: The Influence of Textiles on Corona Discharge Created Around a Human Fingertip. FIBRES & TEXTILES in Eastern Europe January/ December 2007, vol. 15, no. 5-6 (64 - 65).
14. Ciesielska, I.L.: The Precursory Analysis of the Influence of Garments on Corona Discharge Created Around a Human Fingertip. Textile Research Journal vol. 80(3): 216-225.
15. Ciesielska I.L., Masajtis, J.: The preliminary studies of influence of garments on human beings' corona discharge. International Journal of Clothing Science and Technology 2008, vol. 8, issue 5, pp: 299 - 316.
16. Ciesielska, I.L., Mokwinski, M., Orlowska - Majdak, M.: Influence of different kind of clothing on selected circulatory, respiratory and psychomotor parameters during moderate physical exercise. International Journal of Occupational Medicine & Environmental Health. No 3, 2009.
17. Ciesielska, I.L., Masajtis, J. Orlowska - Majdak, M.: The influence of garments on chosen parameters of human physiology and feeling of comfort during physical effort. The 7th World Textile Conference AUTEX Biella, Italy, 2008.
18. Ciesielska, I.L., Masajtis, J. Orlowska - Majdak, M.: The experimental approaches in the context of the influence of textiles on humans well-being. The 8th World Textile Conference AUTEX, CESME - IZMIR,Turkey, 2009.
- Войдите или зарегистрируйтесь, чтобы получить возможность отправлять комментарии


 Нанотехнологии в водоочистке: достижения отечественной науки на службе здоровья.
 Фильтры для воды "Геракл" с графеновым сорбентом: полный каталог и прайс-лист.


